Data Handling
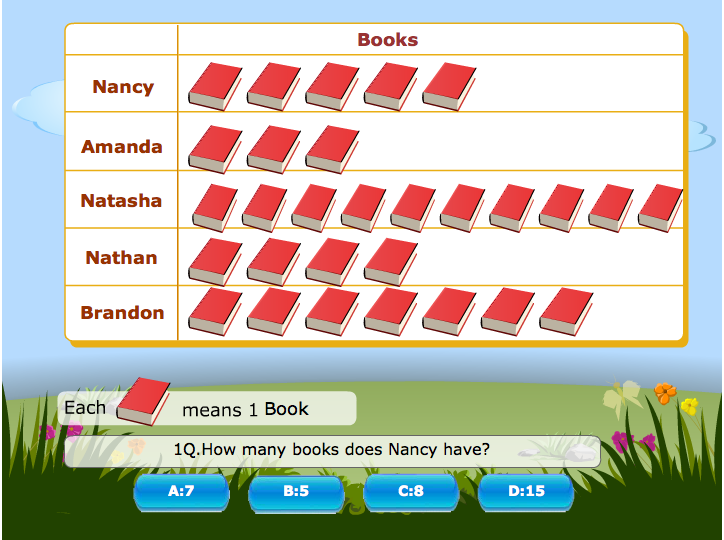
Pictograph
This is a great learning game that gives children the opportunity to interpret data from a pictograph and answer questions.
Venn Diagrams
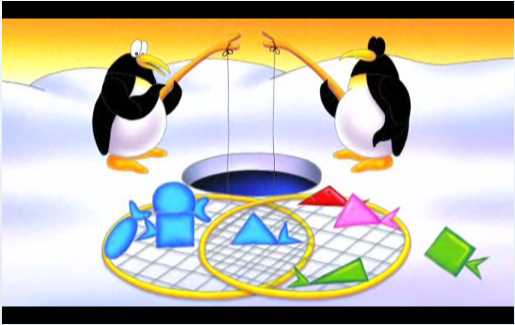
This is a video resource that is a great introduction to Venn diagrams.
At the South Pole, two animated penguins are fishing through a hole in the ice. The first penguin only likes blue fish. The second penguin does not care what colour the fish are as long as they are triangular in shape.
When they catch fish which are neither blue nor triangular the fish do not go into either of the nets. Sometimes the penguins catch fish which are both blue and triangular and thus come to an overlapping arrangement to make a Venn diagram.
As a result blue and triangular fish can be in both nets at the same time. More fish are sorted by the penguins and this allows the concept to be reinforced further.
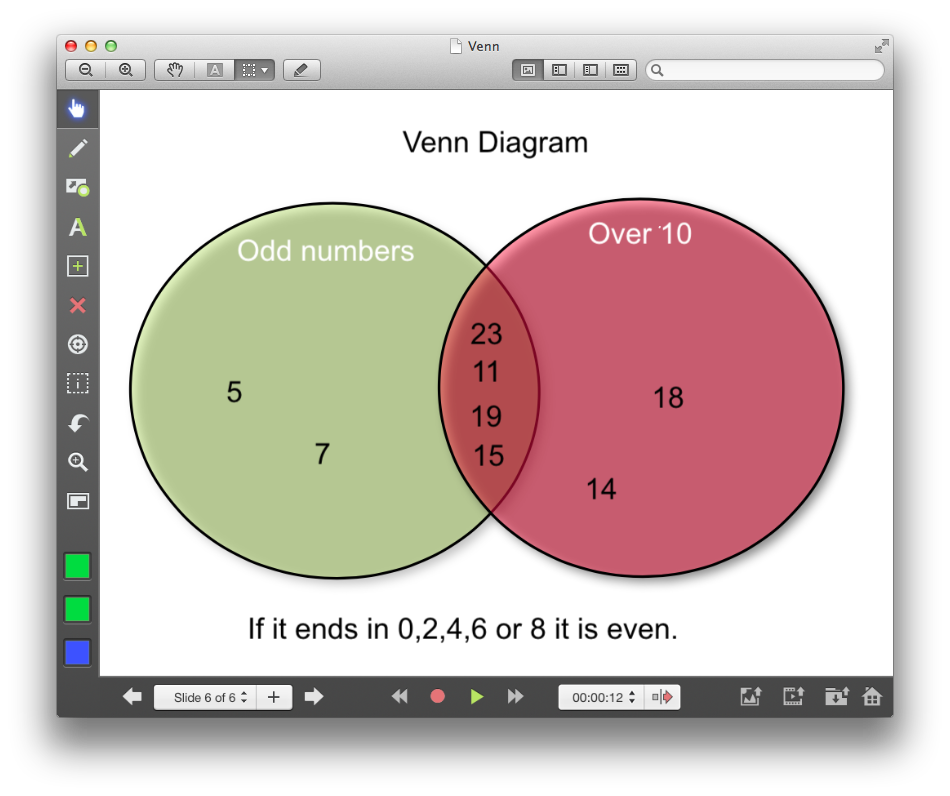
Venn Diagrams and Explain Everything
This is a sorting lesson and can be completed in the PE hall. You can start by simply sorting into two (unconnected) circles and build to a venn diagram. Some teachers like using hoops to illustrate this lesson and it works well.
This activity reinforces the understanding of odd and even numbers and numbers up to 20.
To access the full lesson plan click here.
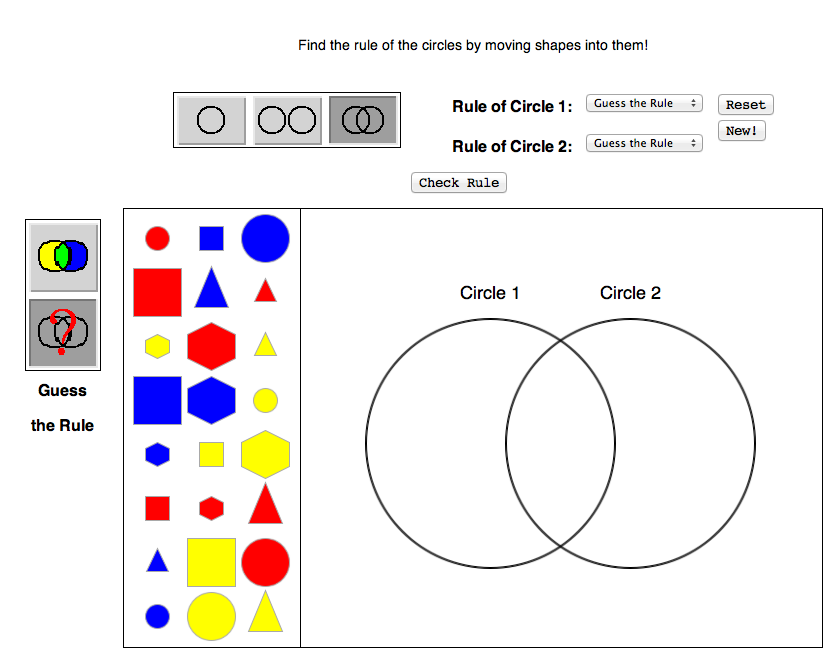
Venn Diagrams
This simple resource allows your children to create their own simple venn diagram. You can encourage the children to sort in different ways independently or it can be completed as a whole class task to introduce the concept.
It also explores sorting in a step-by-step manner to help simplify the concept. Great resource!
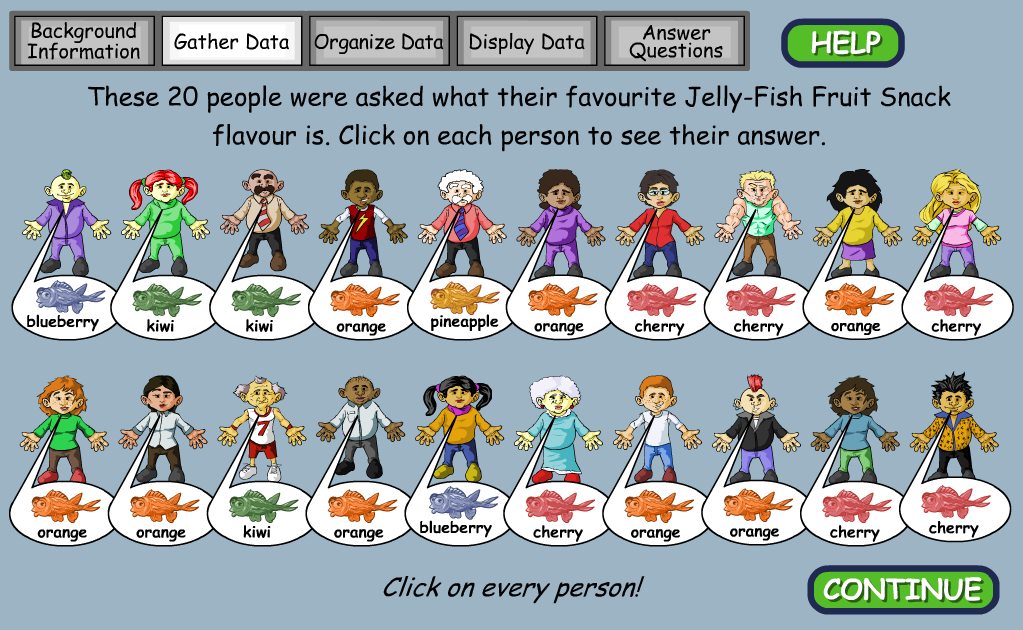
Data Collection
This is a link to a great data collection activity. You must count which flavour the customers prefer, create a tally chart and then a bar graph to show the data.
After the data has been organised, your children will then answer questions.
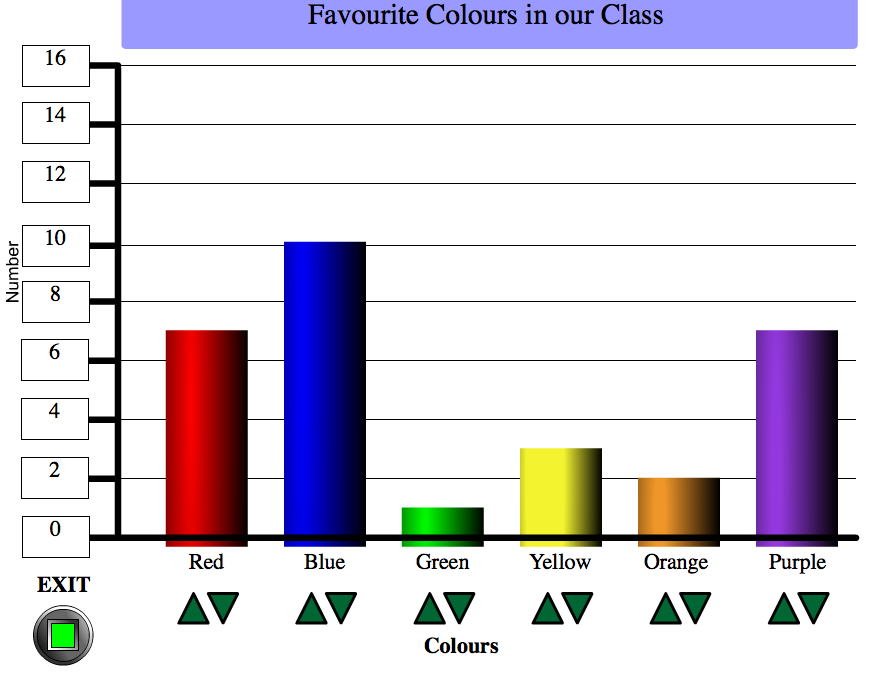
Bar Graph (customisable)
Let the children create their own bar charts using this customisable game. The children can decide the: title, axis topic and numbers (on y axis).
This is a great tool as it allows the children to think about what happens when the total is between two amounts.
Let the children do their own research on a topic of interest to them.
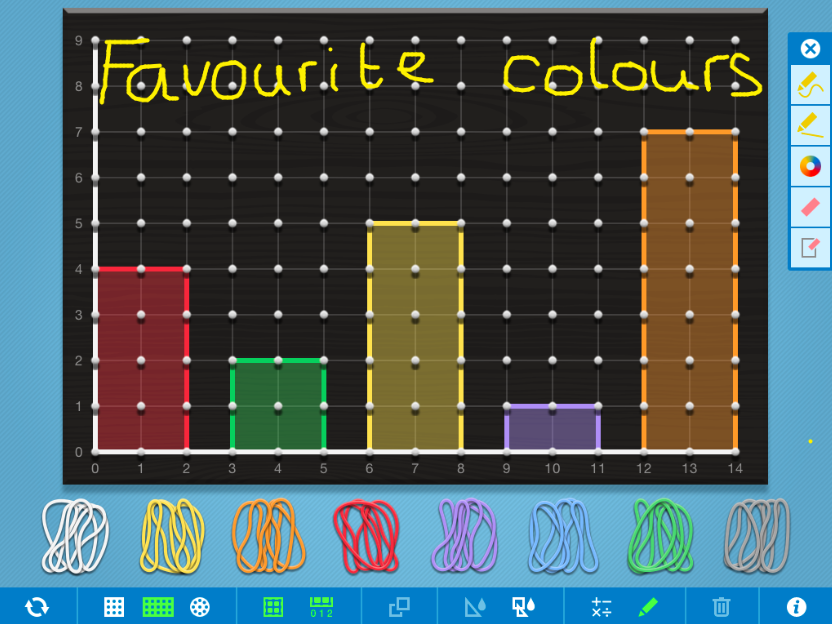
Bar Graph and Geoboard
Your children can gather data and display it using a bar chart using the Geoboard app.
Click the image to see how it is done.
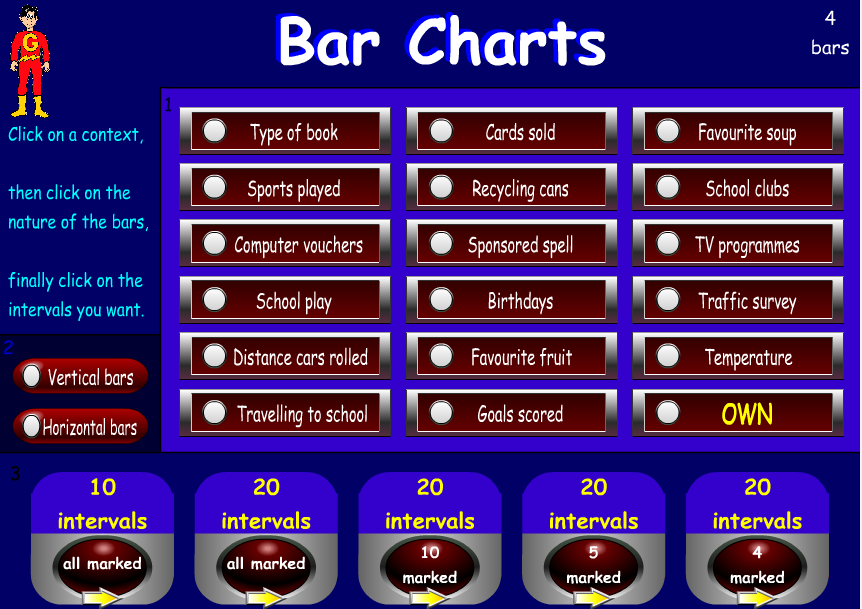
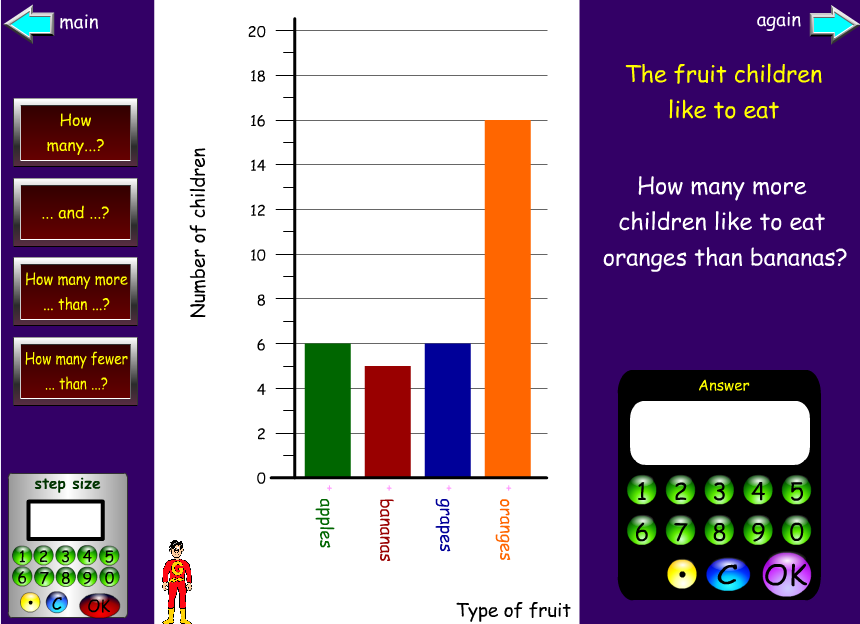
Bar Charts
Once the topic and number range has been selected, your children must answer the questions on the right hand side of the page that are linked to the bar chart.
Great independent activity for KS1 and KS2.
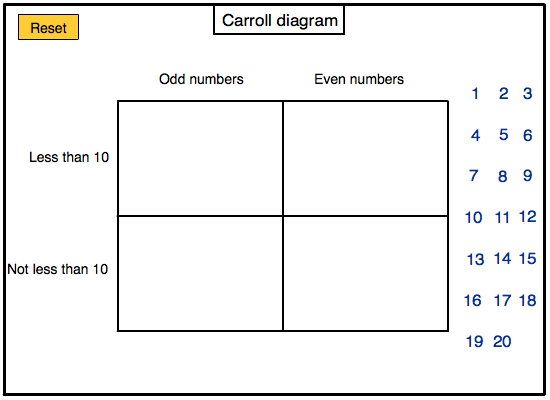
Carroll Diagrams
A fantastic activity to allow children to practise sorting using carroll diagrams.
This game is linked to odd and even numbers.
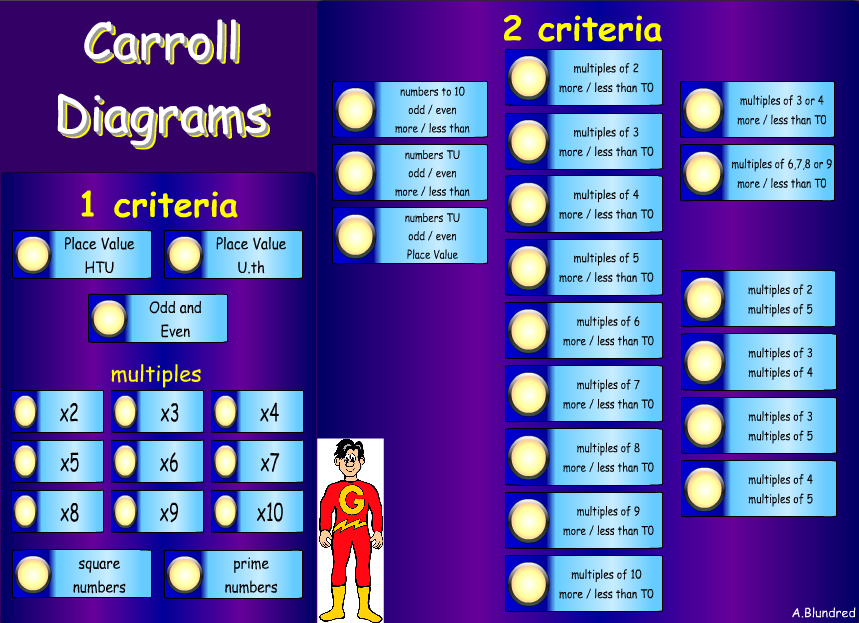
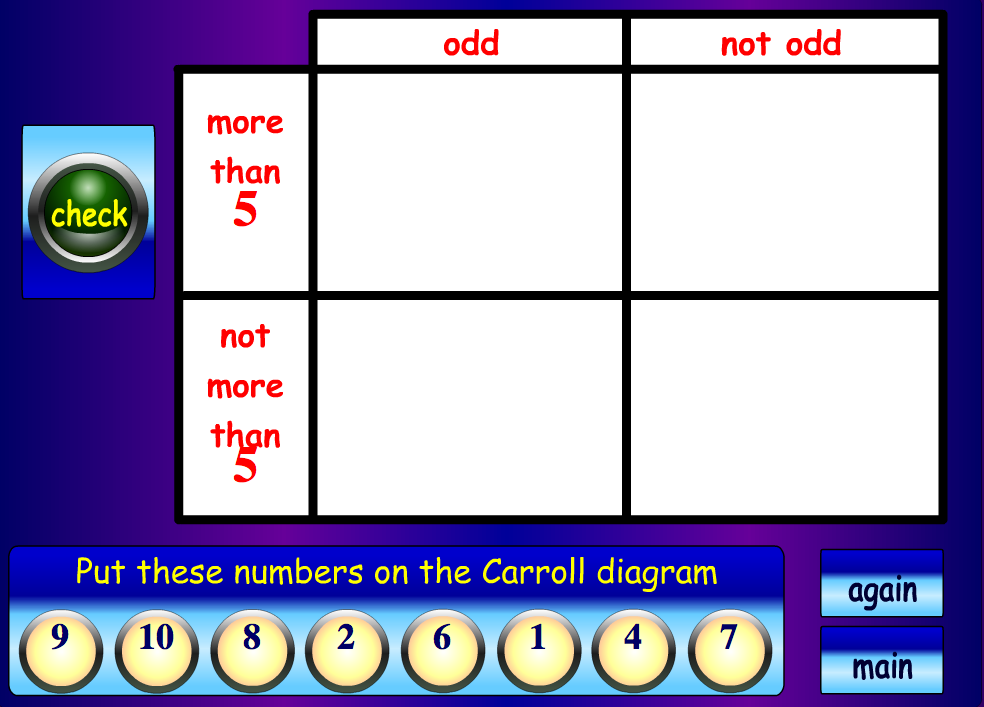
Carroll Diagrams
This is a great resource to use when learning about carroll diagrams.
You can set the criteria to take a different focus each time. For example, more or less, multiples and odd and even.
Great to use from Early KS1 right through to KS2.
Robinson Crusoe Tally Charts
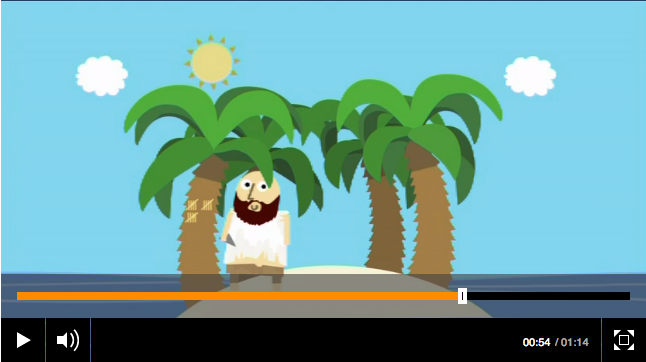
This is a fantastic lesson introduction when teaching your class about tally charts.
Robinson Crusoe is stranded on a desert island struggling to keep track of the passing days. That is until he comes up with a SUPER way of keeping track of the time.
By grouping in fives, Robinson uses a tally chart to keep track of the passing days.
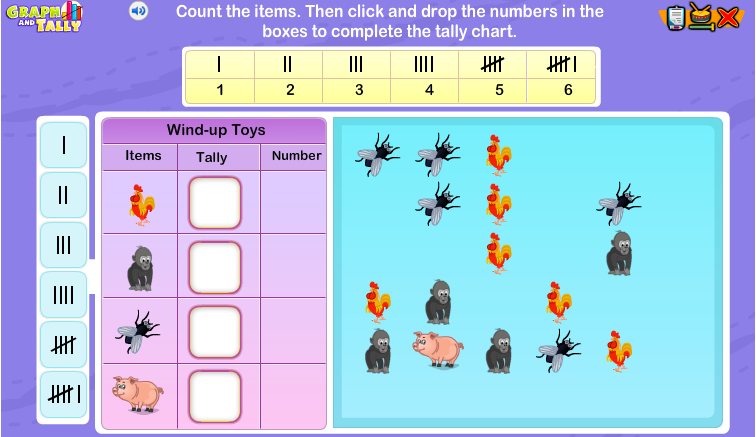
Tally Chart
This game introduces your children to tally charts. They must count the different animals and match the amount to the tally.
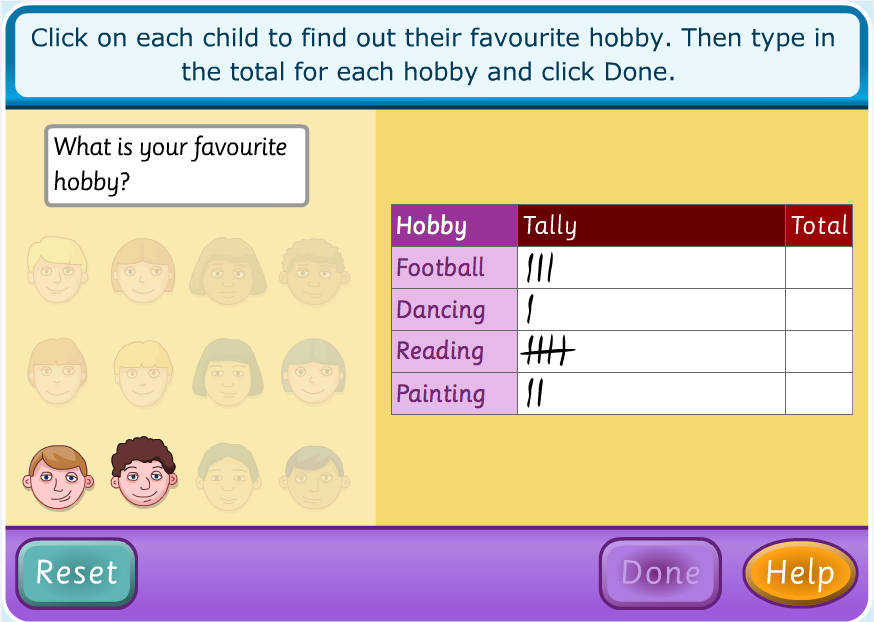
Tally Chart
This is another great interactive game that encourages the children to gather information and show the results using a tally chart.
Once the children complete this activity, they could create a tally chart of their own and gather information from their classmates.
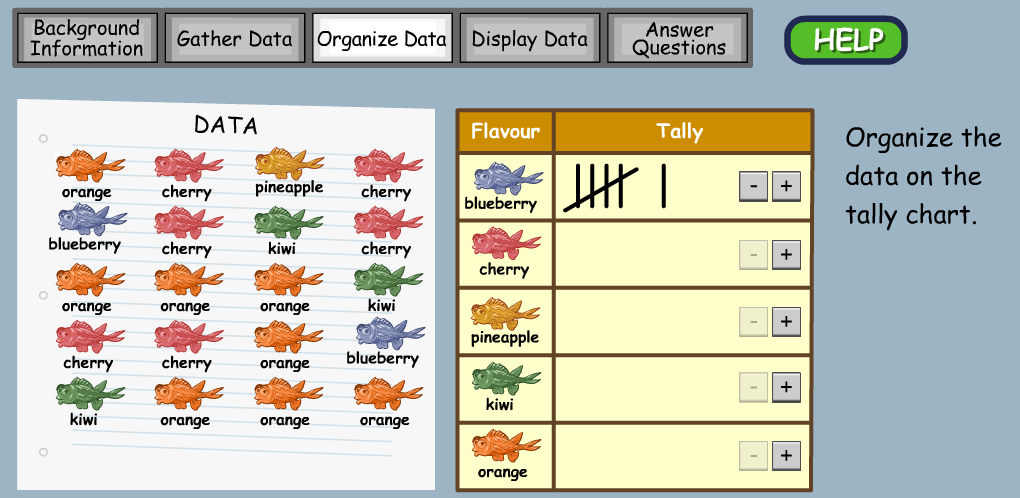
Tally Chart
This learning games encourages your children to find information, count carefully and display data using a tally chart. This is a great resource as it allows your to keep track when counting by clicking the image to fade the colour.
Discuss with your class the most/least popular and differences in amounts – how many more cherry than kiwi? Etc.
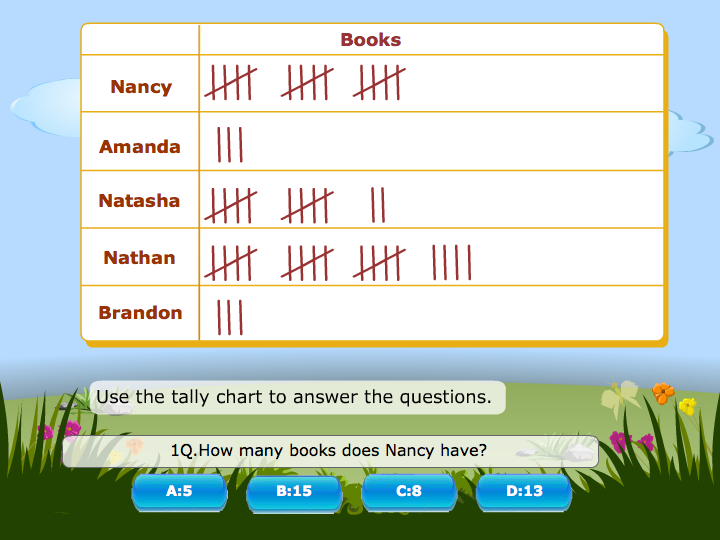
Tally Chart
This is a great learning game to allow your children to develop their skills at reading tally charts and gathering information.