Data Handling
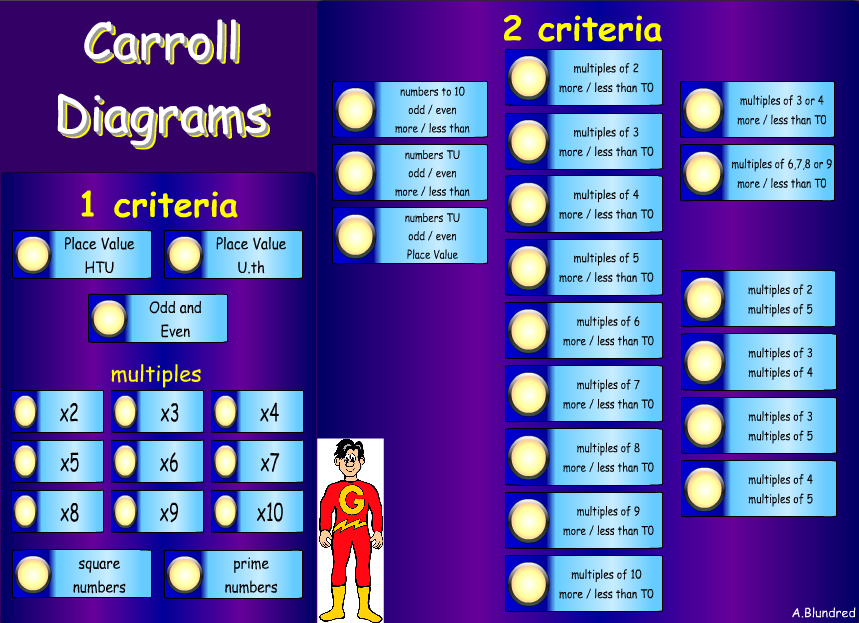
Carroll Diagrams
This is a great resource to use when learning about carroll diagrams.
You can set the criteria to take a different focus each time. For example, more or less, multiples and odd and even. Great to use from Early KS1 right through to KS2.
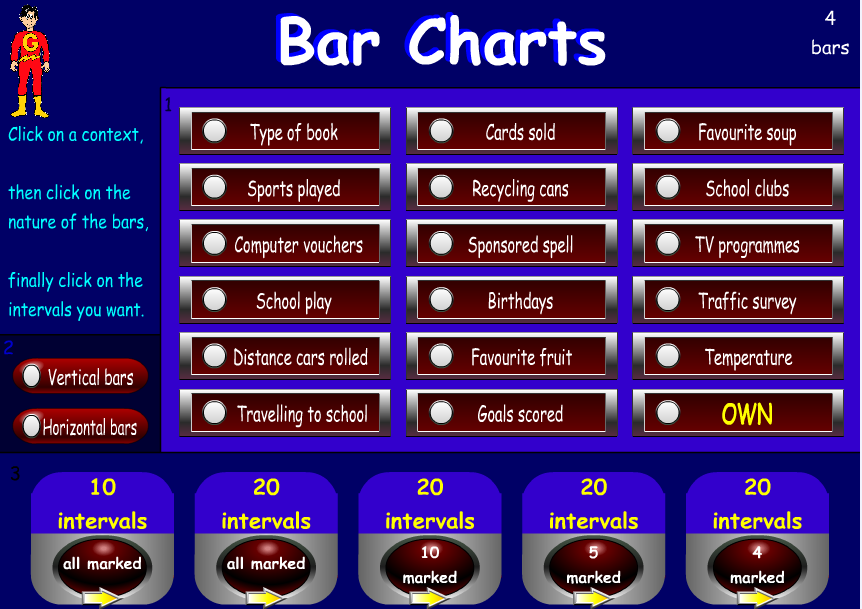
Bar Charts
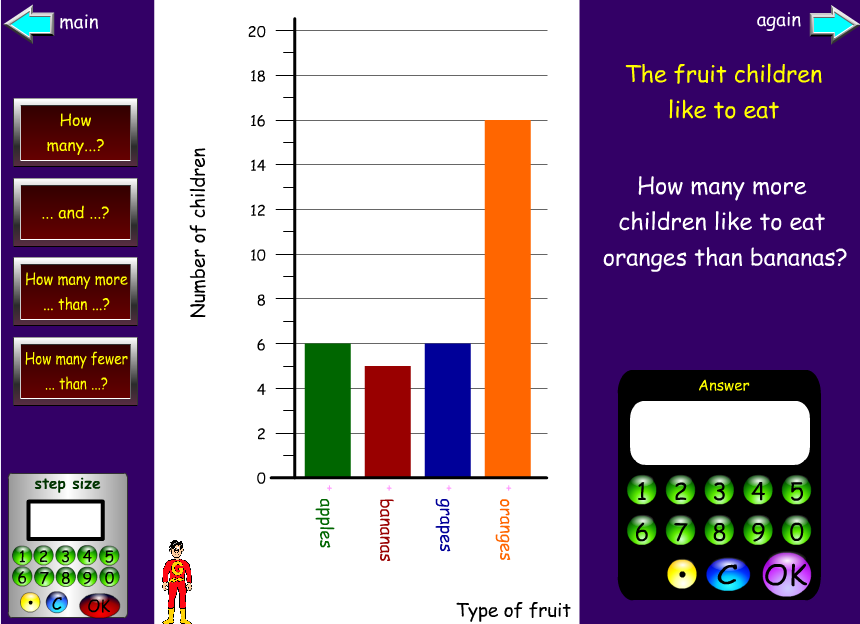
Once the topic and number range has been selected, your children must answer the questions on the right hand side of the page that are linked to the bar chart.
Great independent activity for KS1 and KS2.
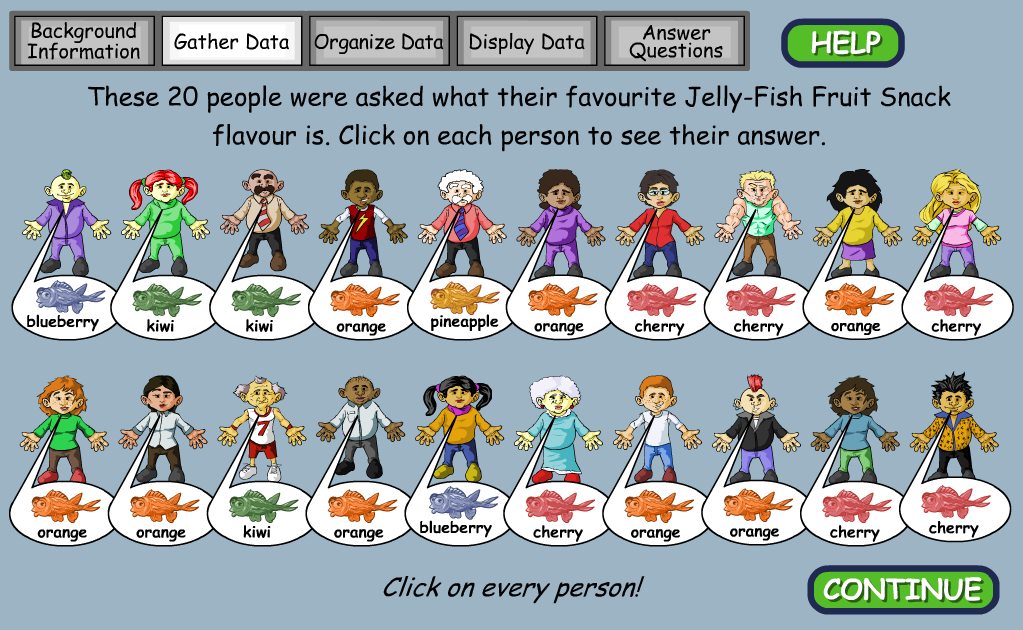
Data Collection
This is a link to a great data collection activity. You must count which flavour the customers prefer, create a tally chart and then a bar graph to show the data. After the data has been organised, your children will then answer questions.
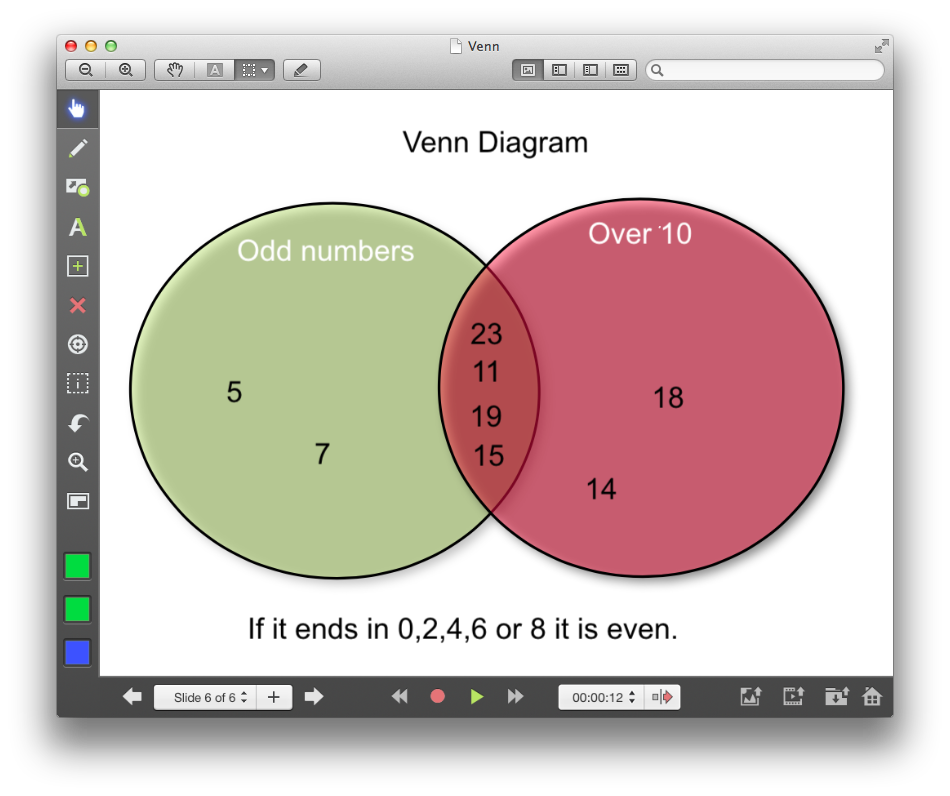
Venn Diagrams and Explain Everything
This is a sorting lesson and can be completed in the PE hall. You can start by simply sorting into two (unconnected) circles and build to a venn diagram. Some teachers like using hoops to illustrate this lesson and it works well.
This activity reinforces the understanding of odd and even numbers and numbers up to 20.
To access the full lesson plan click here.